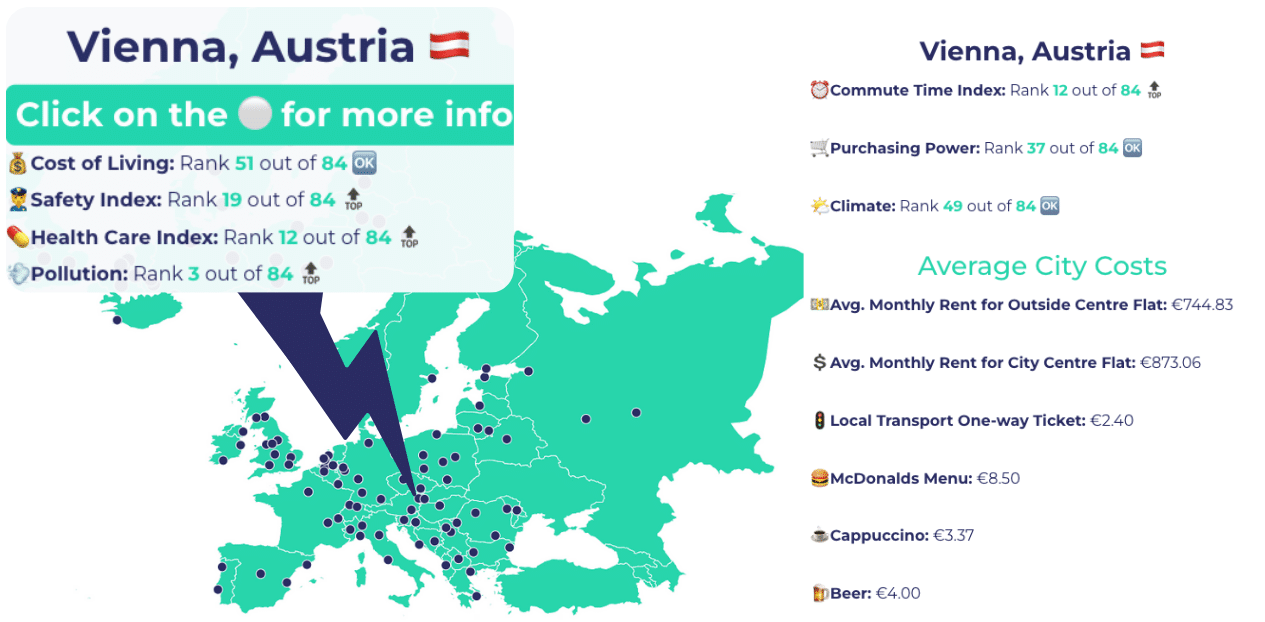
Let City Rank find your dream city
Do you feel like moving but are unsure where? City Rank is here to help compare all the European cities out there + give you inside knowledge!
Need to know which are the hottest startup hubs in Europe?
City Rank has it all in one place – it is all in your hands now!

Heroes Top 10 Cities
| City | Country | Heroes Ranking |
|---|---|---|
| The Hague | Netherlands | 1 |
| Basel | Switzerland | 2 |
| Valencia | Spain | 3 |
| Vienna | Austria | 4 |
| Geneva | Switzerland | 5 |
| Eindhoven | Netherlands | 6 |
| Copenhagen | Denmark | 7 |
| Edinburgh | United Kingdom | 8 |
| Dusseldorf | Germany | 9 |
| Cambridge | United Kingdom | 10 |
The Heroes Data
The City Rank is calculated based on demographic key figures but also highlights specific startup datapoints.
We have invested and updated the data (2022) presented for you in extensive databases to examine various perspectives of European cities. The ones of focus are:
- Cost of living
- Climate
- Pollution
- Safety index
- Purchasing power
- Traffic commuting
- Health care
Additional Daily Expenses
We have also added daily information regarding the cost of certain activities such as:
- Cost of transport (one-way ticket)
- Cost of an apartment (rent monthly) in the centre
- Cost of an apartment (rent monthly) outside the centre
- Cost of a beer
- Cost of a Cappuccino
- Cost of a McMenu

Top European Cities for Startups
| City | Country | Global Rank 2021 | Rank Change 2020-2021 |
|---|---|---|---|
| London | United Kingdom | 5 | -2 |
| Paris | France | 11 | +1 |
| Berlin | Germany | 13 | -5 |
| Stockholm | Sweden | 24 | +5 |
| Amsterdam | The Netherlands | 29 | -9 |
| Barcelona | Spain | 37 | -10 |
| Munich | Germany | 38 | 0 |
| Helsinki | Finland | 44 | -5 |
| Madrid | Spain | 45 | -10 |
| Dublin | Ireland | 51 | +3 |
Startup Data
Our main data is taken from Numbeo, however, we have also leveraged data which is displayed in our ‘Top Cities for Startups’ table from Startup Blink. This data is now been updated to 2020 in comparison to 2021. The data behind the startup table focuses on:
- Number of new startups per year
- co-working spaces
- financing options
- freedom of speech among others.
To reflect the ever-changing startup business environment, we are updating our data sources yearly. We are keen on expanding our database to further improve predictions and are open to receiving your recommendations. We hoped this gave you the insights needed to find your dream city!
Our Data
The City Rank is calculated based on demographic key figures but also highlights specific startup datapoints.
We have invested and updated the data (2022) presented for you in extensive databases to examine various perspectives of European cities. The ones of focus are:
- Cost of living
- Climate
- Pollution
- Safety index
- Purchasing power
- Traffic commuting
- Health care
We have also added daily information regarding the cost of certain activities such as:
- Cost of transport (one-way ticket)
- Cost of an apartment (rent monthly) in the centre
- Cost of an apartment (rent monthly) outside the centre
- Cost of a beer
- Cost of a Cappuccino
- Cost of a McMenu
Our main data is taken from Numbeo, however, we have also leveraged data which is displayed in our ‘Thriving startup’ table from Startup Blink. This data is now been updated to 2020 in comparison to 2021. The data behind the startup table focuses on:
- Number of new startups per year
- coworking spaces
- financing options
- freedom of speech among others.
To reflect the ever-changing startup business environment, we are updating our data sources yearly. We are keen on expanding our database to further improve predictions and are open to receiving your recommendations.
We hoped this gave you the insights needed to find your dream city!
Our Data
The City Rank is calculated based on demographic key figures but also highlights specific startup datapoints. We have invested and updated the data presented for you in extensive databases to examine various perspectives of European cities. The ones of focus are:
- Cost of living
- Quality of life
- Climate
- Pollution
- Safety index
- Purchasing power
- Traffic commuting
- Health care
- Apartment stats
We have also added daily information regarding the cost of certain activities such as:
- Cost of transport (one-way ticket)
- Cost of an apartment in the centre
- Cost of an apartment outside the centre
- Cost of a beer
- Cost of a Cappuccino
- Cost of a McMenu
Our main data is taken from Numbeo, however, we have also leveraged data which is displayed in our ‘Thriving startup’ table from Startup Blink. This data is now been updated to 2020 in comparison to 2021. The data behind the startup table focuses on
- Number of new startups per year
- coworking spaces
- financing options
- freedom of speech among others.
To reflect the ever-changing startup business environment, we are updating our data sources half-yearly. We are keen on expanding our database to further improve predictions and are open to receiving your recommendations.
We hoped this gave you the insights needed to find your dream city!


